HUSD Losing Enrollment, Possibly To CVUSD
In Which: We explain how enrollment funds HUSD, Enrollment trends bad across the State, and Trustee Bruckner-Carrillo alleges students leaving for Castro Valley

How Enrollment And Attendance Fund HUSD
On November 5th, the Hayward Unified School District (HUSD) Board of Trustees received one of their many budget updates. This one, however, focused less on impending cuts and more on how the District itself is funded—primarily through enrollment and attendance. The presentation showed that, due to demographic trends, enrollment is expected to continue decreasing in the future, putting more and more strain on future budgets.
Assistant Superintendent of Finance Amy Nichols also revealed that there is a new website that brings together all of the budget presentations since July of this year. husd.us/budget is where you’ll be able to easily view all of the budget presentations we’ve been covering here over the last several months—in case you want to check our work.
Revenue Tied To Enrollment And Attendance
Assistant Superintendent Nichols made clear that the District budget is hyper-dependent on the number of students who attend District schools. “Our revenue is directly related to that decline or increase in enrollment and attendance,” she said. This is part of the reason that HUSD is facing financial difficulties.
The Fiscal Health Risk Analysis (FHRA) from the Fiscal Crisis and Management Assistance Team (FCMAT) listed Enrollment and Attendance as an area of concern while they were helping HUSD through the last round of cuts in Spring. The biggest questions that the District need to be able to answer are: How are enrollment/attendance trending? Are they being monitored and analyzed? and Are the projections accurate for budgeting purposes?
But how these things work isn’t always clear to parents and the larger community. And there are two distinct, but related, things that the District keeps an eye on: Enrollment and Average Daily Attendance (ADA).
What Is Enrollment?
Enrollment is the number of students who should be going to school within the District. They’ve signed up for classes. It’s an expected headcount. It doesn’t take into account whether or not students are attending class or how often, just whether or not they’re registered in the District.
This is counted once a year on the first Wednesday in October—this year, that would’ve been October 1. According to the presentation, AY 25/26 enrollment is estimated to be around 17,000 students.
What Is Average Daily Attendance?
Average Daily Attendance (ADA) is the actual attendance rate of students in classes, usually expressed as a percentage. So if students show up for school, the percentage increases. If they miss school for any reason—sick, vacation, skipping class, it doesn’t matter—the rate goes down.
This rate of attendance is used for budgeting purposes and is reported three times per year to the California Department of Education and the Alameda County Department of Education. The numbers are sent in December, April, and June.
How Does This Work In Practice?
So in order to figure out ADA, we need three things: number of school days, how many students should be there, and how many students are there on each day. Ms. Nichols used an example of a fake school with 10 students and a 5-day long school year—to make the math easy.
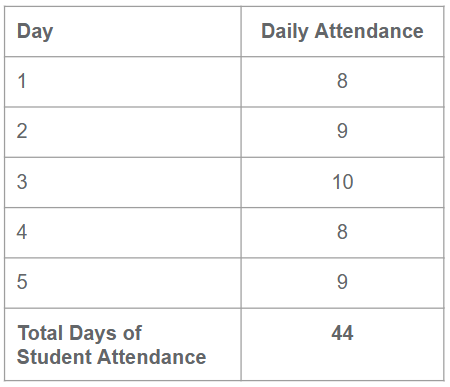
Total Number of Enrolled Students = 10
Total Days Of Student Attendance = 44
School Days = 5
Average Daily Attendance: 44 / 5 = 8.8
Attendance Rate: 8.8 / 10 = 88%
That’s A Lotta Math!
Yes. Yes it is. But that’s how funding works. There are a few things that are important to notice about how this actually shakes out in practice.
- Getting a 100% Attendance Rate is almost impossible. That’d mean every single student in the whole district showing up every single day without fail. HUSD currently enjoys a ~90% attendance rate, which is really good.
- ADA means money. High ADA means that the District gets more Local Control Funding Formula (LCFF) money, and also means that enrolling a bunch of students who don’t show up can lose the district money.
Not All Students Worth The Same
Interestingly, some students bring more money to the District than others. Transitional Kindergarten (TK) students bring in the most ($20,822 per ADA), followed by High School students ($17,197 per ADA). But students in Grade 4-6 only bring in $14,046 per ADA—over $6,000 less per student per year than TK students.
According to Ms. Nichols, there’s a good reason. “It’s linked to what the staffing and support requirements are for students in these grade levels,” she said. For example, TK and Grades K-3 have smaller classes, while High School students need support staff like counselors.
This gives an incentive for HUSD to invest really heavily in the TK program, which is just taking off. Each one of those kids brings in a lot of money and, thanks to Gavin Newsom’s initiative, more and more children are being enrolled in TK. This also makes it more important to be able to capture that enrollment—both for the immediate funding injection, and also hopefully keep students in HUSD schools.
Declining Enrollment Statewide
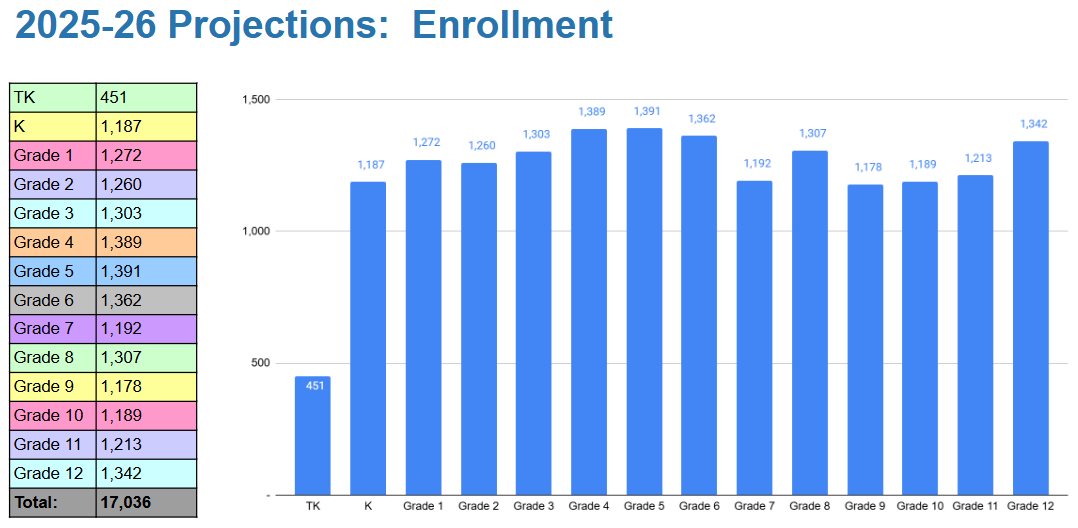
This graph shows the enrollment projections for this school year. There are a lot of reasons this graph is interesting, but for the purposes of funding it highlights enrollment decline. As Ms. Nichols pointed out, if you look at Grade 5, you can see that every year before it has fewer and fewer students. There are some bumps in there, but that’s the general trend.
Another interesting thing to note is how the enrollment drops off between transitions. From 6th to 7th grade, when students transition from Elementary to Middle schools, there’s a big drop. Same from 8th to 9th grade, when students transition from Middle to High schools.
Using this data, historical data, and statewide projections, the District is predicting between 1.5% and over 2% enrollment decline every year for at least the next 4 years. That’s almost 1,000 fewer students over that time period.
Confusing Budget Projections
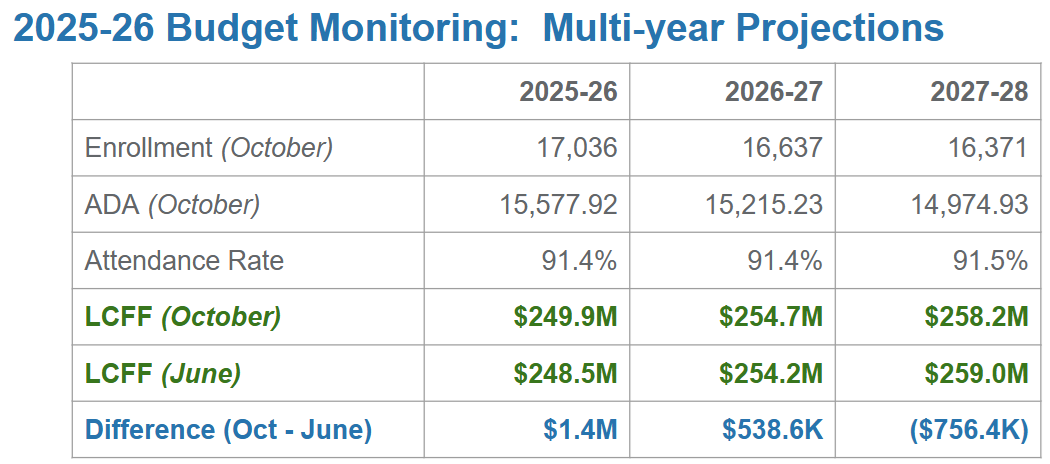
This chart was confusing for me, so let’s clarify it a little bit. The LCFF (June) numbers are the expected LCFF revenue budgeted the June before the LCFF (October) numbers. For example, the 2025-26 LCFF (October) is higher than the LCFF (June). That means that this year the District is expecting to get $1,400,000 more in LCFF money than they expected in June of this year.
That starts to change in 2027-28 when, because of decreasing enrollment and ADA—despite a similar attendance rate—the District will get around $756,000 less than expected from LCFF funding. That’s already $2,000,000 lost over 3 years and it’s only going to get worse.
“I share this to tell you that given where we are as a district,” Ms. Nichols said, “managing and monitoring these revenues are critical.”
What Does This All Mean??
Because the State of California funds schools based on Average Daily Attendance, the fewer students the District has enrolled, the less money they will receive. The budget is expected to shrink in coming years with no sign of stopping. And this is not something that HUSD can address on its own because it’s a state-wide issue.
According to the California Department of Education, enrollment decline is slowing—statewide it only declined by .54% last year. The news release goes on to say that the change is due to increased TK enrollment, which has increased over 17%, and Dual Language Initiative (DLI) programs.
However, the California Department of Finance paints a very different picture. Although it says that, over the next 10 years, 14 counties are expected to increase K-12 enrollment by 2034-35, that’s only 24% of counties statewide. Overall state enrollment is expected to keep declining. “Over the next ten years, if current trends in fertility and migration hold, a further decline of 586,500 in total enrollment is projected, resulting in total enrollment of 5,219,700 by 2034-35,” it reads.
This means that every school district is going to be competing for fewer and fewer students while everyone’s budgets continue to decrease with enrollment decline. Individual counties and districts may fare better due to affordability or other factors, but 3/4ths of counties are expecting continued enrollment decline over the next 10 years.
Where Are Students Going?
Trustee Austin Bruckner-Carrillo asked why the District didn’t seem to be prepared for an influx of enrollment of Transitional Kindergarten students. “My understanding is there’s a considerable number of students,” he said, “that didn’t enroll in Hayward schools.” He alleged that 84 students were still waiting to be enrolled.
Assistant Superintendent of Finance Amy Nichols responded that the situation does have issues. “This is new to us as schools,” she said. She explained that there has been a 5-year rollout for TK at the state level and that it’s been difficult to project what the need would be, lacking historical data. She insisted that it wasn’t just HUSD that was having issues. “That’s not something that’s been easy for us or any district,” she said. “[Space issues are] a challenge being experienced by many schools and many districts.”
Trustee Bruckner-Carrillo then alleged that, due to issues with enrollment, students were leaving HUSD for a neighboring district—likely Castro Valley Unified School District (CVUSD). “Enrollment is up in neighboring districts,” he said. “Right over 580, enrollment is up in that district and it’s in large part thanks to Hayward Unified School District and our students.” He requested a report on the number of students lost to other districts.
Superintendent Chen Wu-Fernandez stepped in to clarify that students can’t arbitrarily leave the district. “Their reason for leaving has to meet one of our criteria for exiting Hayward,” she said. She explained that leaving HUSD would require an interdistrict transfer which has 8 valid reasons for leaving the district and needs to be signed off by both HUSD and the other district in question.
Thanks for reading Hayward Herald! This post is public so feel free to share it.
The reasons are: Child Care (K-6 only), Parent Employment, Sibling, Health and Safety, Specialized Program, Continuing Enrollment, Final Year, and Change in Residence. Almost half of them require some letter from the parent/guardian justifying the change. However it’s unclear if this applies before a student has even enrolled in HUSD, and likely doesn’t apply to private schools.
Superintendent Wu-Fernandez also explained that many parents want their student to go to a particular school site and are waiting until there’s space available. Finally, facilities are also an issue—though one that may not be quickly solved.
During public comment, the President of the Association of Educational Office and Technical Employees (AEOTE) Deisy Bates alleged that 761 students transferred out of HUSD, which cost the District $11,400,000. She further alleged that most of the students went to Castro Valley Unified and that the 96 TK students waiting to be enrolled cost the district $1,900,000. She further argued that such a loss would fall disproportionately on AEOTE members.
During the last cuts, the School Board tried to keep the cuts as far from the classroom as possible, so they fell heavily on AEOTE workers in the District Office and Administrators.
Maximizing Those Dollars
Trustee Ken Rawdon asked if the LCFF money allocated for each grade are required to be spent within those grades—potentially hinting at using high-value students to bolster finances throughout the District. “We are not technically obligated to use the dollars for that grade level,” Assistant Superintendent Nichols said. “We don’t report our expenditures based on grade level.” However, she said that the money is typically spent within the grade it is earned.
Trustee Oquenda asked if there was any way to compare HUSD to other districts or across the state. “It can be easy as we’re talking about our budget to think, ‘How do we get that number up?’ but is that the right question to be asking?” she asked. She also requested statewide enrollment numbers to compare to HUSD, citing an approximately 4,000 student drop in enrollment since 2018, when she first joined the School Board.
Trustee Rawdon then said he felt certain that the enrollment decline can’t last. “I’m looking at that downward slope that I’ve seen at HUSD for years and years,” he said, “This can’t continue forever, declining enrollment at some point, it has to plateau.” However, Ms. Nichols wasn’t so optimistic. “Each grade that comes up has fewer students in it than the one after it,” she said.
President Peter Bufete asked if there were any strategies to maximize the Average Daily Attendance (ADA). “In many ways, it is difficult to increase or raise ADA rates,” Ms. Nichols said. “We already have fairly strong ADA rates in the District.” She pointed out that it doesn’t take many students to drop the number in the first place. She also cited issues with parents keeping kids at home more frequently post-COVID, so it may be worth reminding parents about the financial impact of that on the District.
But Ms. Nichols closed by saying that it may be most impactful to remind parents that school is the best place for a student to learn, and that this may be the most effective motivation. Superintendent Wu-Fernandez said that the attendance committee, which was first discussed back in April, “launched recently” and will be looking at strategies to help with attendance issues.


Comments ()